
ChartGPT
ChartGPT is an AI-powered tool that transforms text and data into visually appealing charts with extensive customization options.
Product Overview
What is ChartGPT?
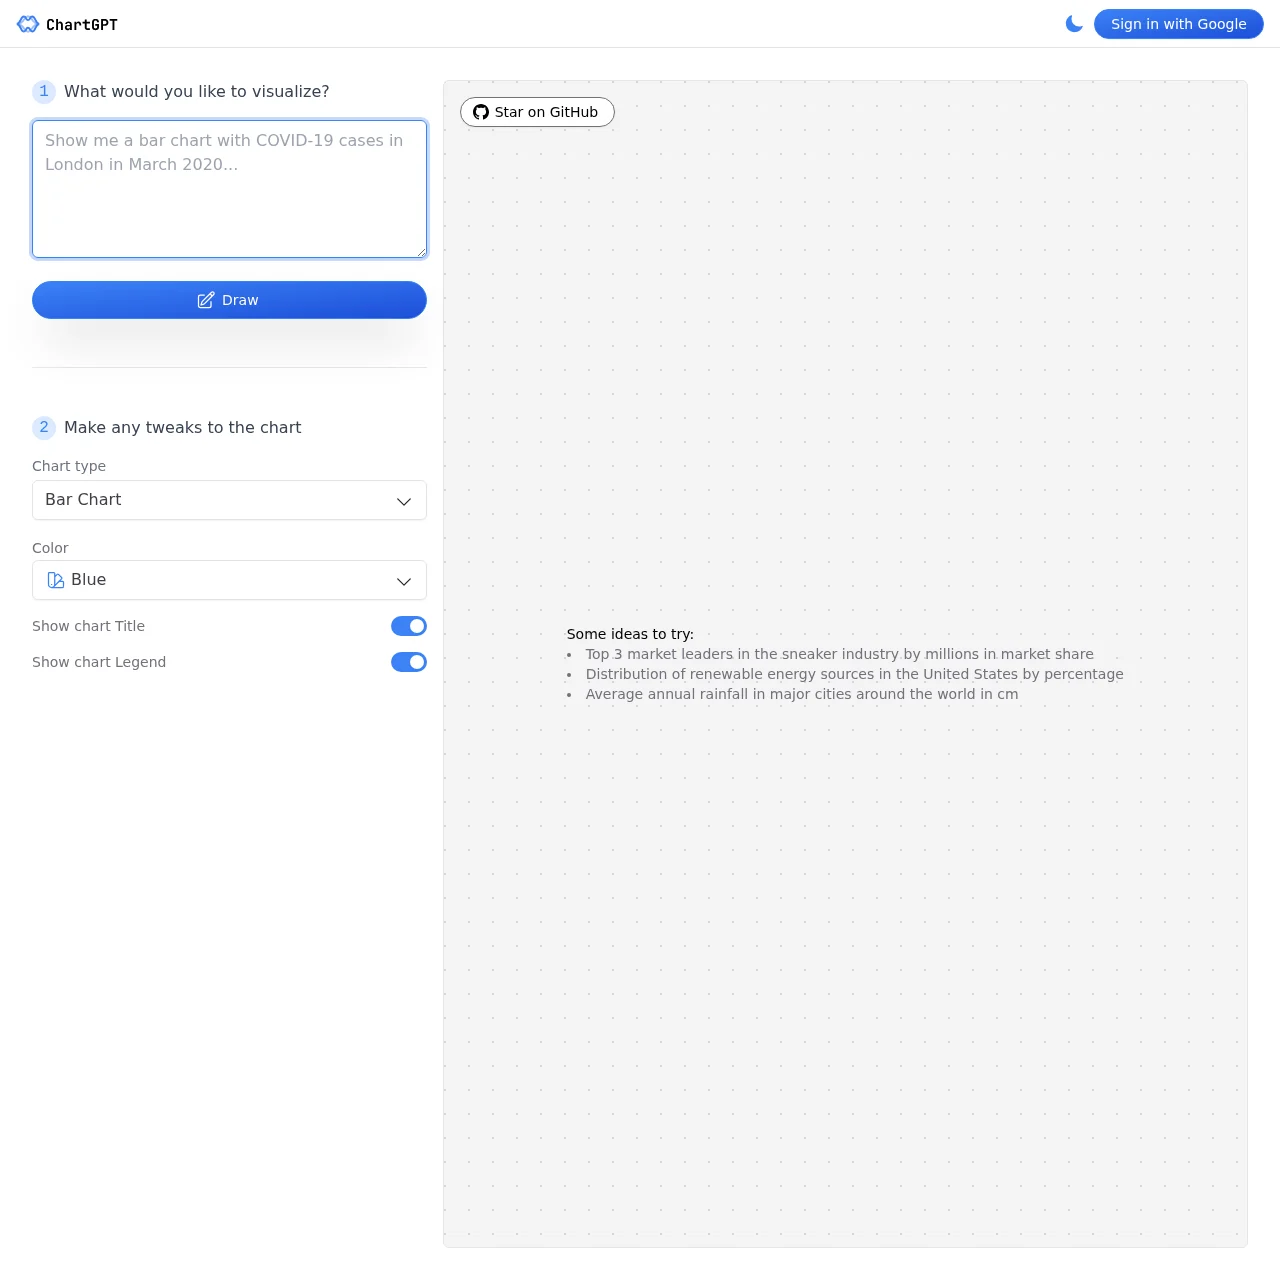
ChartGPT simplifies data visualization by allowing users to generate charts directly from text prompts or data inputs.
Leveraging AI, it offers an intuitive platform to create, customize, and refine charts for various needs, from business analytics to educational presentations. Easily integrate with your Google account for a seamless workflow.
Key Features
AI Chart Generation
Effortlessly create charts by simply describing what you want to visualize or by providing your data directly.
Comprehensive Customization
Tailor your charts with a wide array of types, color schemes, titles, and legend options to precisely match your requirements.
Traffic Analytics
chartgpt.dev
Estimated Monthly Visits
Similarweb public trend snapshot